data = generate_synthetic_data(n=1000)
refplot = AgeRefPlot(data, "val1")
refplot.plot()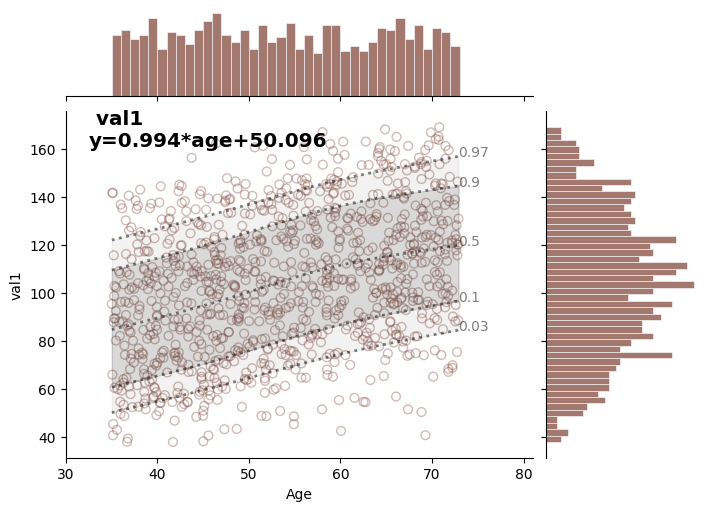
 get_gam_expectiles (X:numpy.ndarray, y:numpy.ndarray,
                     expectiles:List[float]=[0.03, 0.1, 0.5, 0.9, 0.97])
Fit Expectile Generalized Additive Models (GAMs) for given expectiles.
Args: X (ndarray): Feature data for the model. y (ndarray): Target variable for the model. expectiles (List[float]): List of expectiles to fit. Default is [0.03, 0.1, 0.5, 0.9, 0.97].
Returns: Tuple[ndarray, Dict[str, ndarray]]: A tuple containing a grid of X values for prediction and a dictionary with expectiles as keys and their corresponding model predictions as values.
 AgeRefPlot (data:pandas.core.frame.DataFrame, val_col:str,
             age_col:str='age_at_research_stage', sex_col:str='sex',
             sex:Optional[int]=None, val_color:Optional[str]=None,
             ax_main:Optional[matplotlib.axes._axes.Axes]=None,
             ax_agehist:Optional[matplotlib.axes._axes.Axes]=None,
             ax_valhist:Optional[matplotlib.axes._axes.Axes]=None,
             age_bins:Optional[numpy.ndarray]=None,
             val_bins:Optional[numpy.ndarray]=None, linear_fit:bool=True,
             expectiles:Optional[List]=[0.03, 0.1, 0.5, 0.9, 0.97],
             top_disp_perc:float=99, bottom_disp_perc:float=1,
             robust:bool=True, scale:float=1.0,
             transform:Optional[Callable]=None, make_fig:bool=True)
Initializes the AgeRefPlot class.
Args: data (pd.DataFrame): A pandas DataFrame containing the data. val_col (str): The name of the value column in the DataFrame. age_col (str): The name of the age column in the DataFrame. sex_col (str): The name of the sex column in the DataFrame. sex (Optional[int], optional): The sex to filter the data by. 0 for females and 1 for males. Defaults to None. val_color (Optional[str], optional): The color to use for the value plot. Defaults to None. ax_main (Optional[plt.Axes], optional): The main axis for the plot. Defaults to None. ax_agehist (Optional[plt.Axes], optional): The axis for the age histogram. Defaults to None. ax_valhist (Optional[plt.Axes], optional): The axis for the value histogram. Defaults to None. age_bins (Optional[np.ndarray], optional): The age bins for the histograms. Defaults to None. val_bins (Optional[np.ndarray], optional): The value bins for the histograms. Defaults to None. linear_fit (bool, optional): Whether to perform a linear fit on the data. Defaults to True. expectiles (Optional[List], optional): Whether to calculate and shpe gam expectiles or not. Defaults to [0.03, 0.1, 0.5, 0.9, 0.97]. top_disp_perc (float, optional): The top percentile to use for display. Defaults to 99. bottom_disp_perc (float, optional): The bottom percentile to use for display. Defaults to 1. robust (bool, optional): Whether to use a robust regression method (HuberRegressor) instead of ordinary least squares for linear_fit. Defaults to True. scale (float, optional): The scaling factor for the value column. Defaults to 1. transform (Optional[Callable], optional): The transformation function to apply to the value column. Defaults make_fig (bool, optional): Whether to create a new figure if axes are not provided. Defaults to True.
data = generate_synthetic_data(n=1000)


refplot = AgeRefPlot(data, "val1")
refplot.plot()
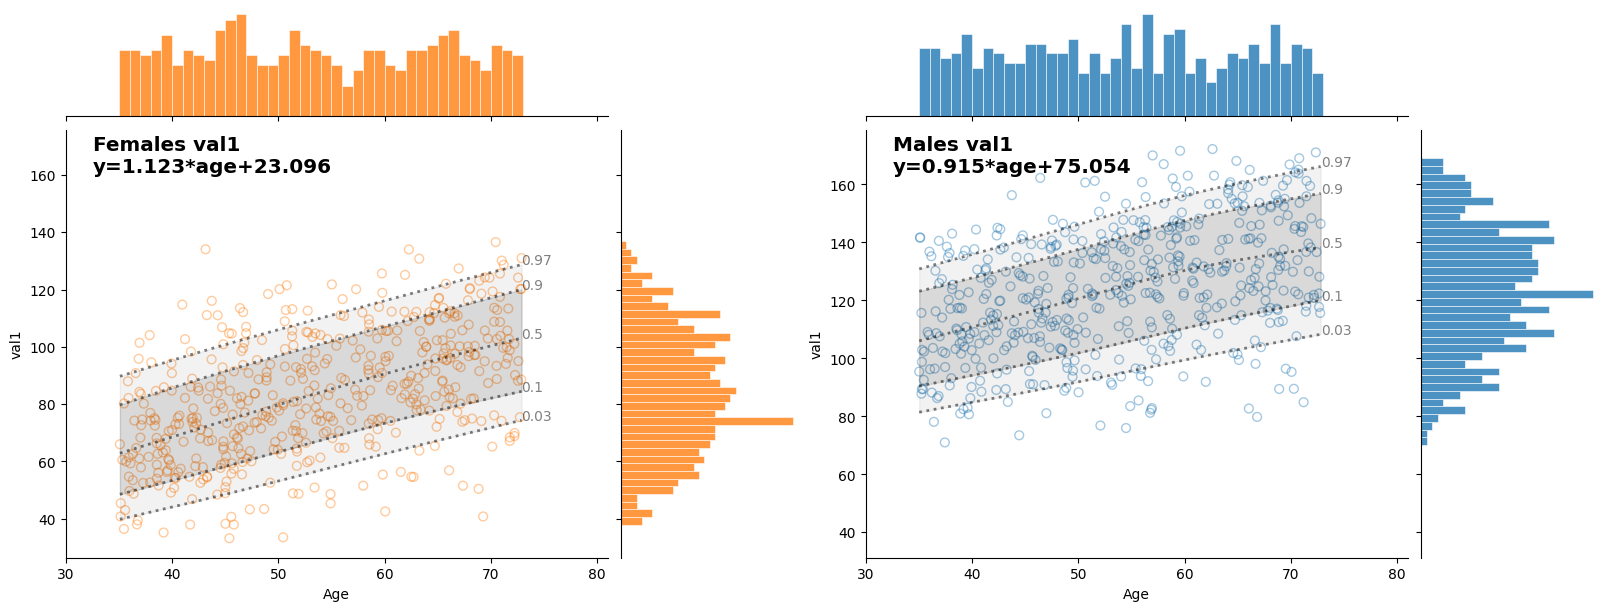
 GenderAgeRefPlot (data:pandas.core.frame.DataFrame, val_col:str,
                   age_col:str='age_at_research_stage', sex_col:str='sex',
                   age_bins:Optional[numpy.ndarray]=None,
                   val_bins:Optional[numpy.ndarray]=None,
                   linear_fit:bool=True, expectiles:Optional[List]=[0.03,
                   0.1, 0.5, 0.9, 0.97], top_disp_perc:float=99,
                   bottom_disp_perc:float=1, robust:bool=True,
                   scale:float=1.0, transform:Optional[Callable]=None)
Initializes the GenderAgeRefPlot class.
Args: data (pd.DataFrame): The input data containing age, value, and gender columns. val_col (str): The name of the value column in the data. age_col (str): The name of the age column in the DataFrame. sex_col (str): The name of the sex column in the DataFrame. age_bins (np.ndarray, optional): An array of age bin edges. val_bins (np.ndarray, optional): An array of value bin edges. linear_fit (bool, optional): Whether to fit a linear regression line. Defaults to True. expectiles (Optional[List], optional): Whether to calculate and shpe gam expectiles or not. Defaults to [0.03, 0.1, 0.5, 0.9, 0.97]. top_disp_perc (float, optional): The top percentile for data display. Defaults to 99. bottom_disp_perc (float, optional): The bottom percentile for data display. Defaults to 1. robust (bool, optional): Whether to use a robust linear regression. Defaults to True. scale (float, optional): The scaling factor for the data. Defaults to 1. transform (Callable, optional): An optional function to apply to the data. Defaults to None.
gender_refplots = GenderAgeRefPlot(data, "val1")
gender_refplots.plot()