Dates plots


source

dates_dist_plot

 dates_dist_plot (df:pandas.core.frame.DataFrame, col:str,
                  sampling_period:str='W-MON', ax:Union[ForwardRef('Extens
                  ionArray'),numpy.ndarray,ForwardRef('Index'),ForwardRef(
                  'Series'),List,range,NoneType]=None,
                  date_col:str='collection_date',
                  ylim:Optional[Tuple[float,float]]=None,
                  quantiles:Optional[List[Tuple[float,str]]]=None)

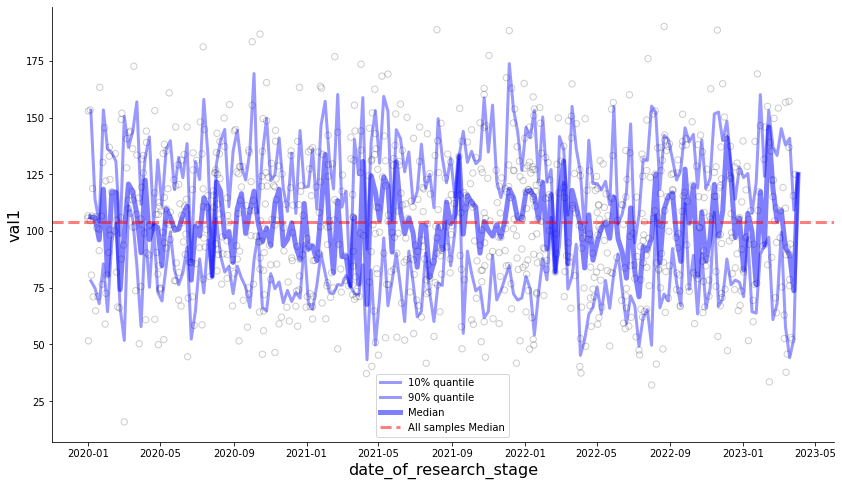
Creates a scatter plot of data points and their statistics based on a specified sampling period.

Args: df (pd.DataFrame): The input DataFrame containing the data. col (str): The column name in the DataFrame to plot. sampling_period (str, optional): The frequency to resample the data. Defaults to ‘W-MON’. ax (Optional[Axes], optional): A matplotlib axes object to plot on. Defaults to None. date_col (str, optional): The name of the date column in the DataFrame. Defaults to ‘collection_date’. ylim (Optional[Tuple[float, float]], optional): A tuple defining the y-axis limits. Defaults to None. quantiles (Optional[List[Tuple[float, str]]], optional): A list of tuples containing quantiles and their labels. Defaults to [(0.1, “10%”), (0.9, “90%”)].

data = generate_synthetic_data()
data.head()
date_of_research_stage age_at_research_stage sex val1 val2
participant_id
0 2022-12-01 57.777073 1 150.216212 56.936487
1 2020-07-29 53.770724 1 117.603875 47.152785
2 2020-09-30 51.326393 1 97.928950 41.250308
3 2022-05-06 61.217276 0 105.169939 41.422605
4 2021-06-29 45.835170 0 54.735540 26.292285
dates_dist_plot(data, col="val1", date_col="date_of_research_stage")