CGM plots


source

CGMPlot

 CGMPlot (cgm_df:pandas.core.frame.DataFrame,
          diet_df:Optional[pandas.core.frame.DataFrame]=None,
          cgm_date_col:str='collection_timestamp', gluc_col:str='glucose',
          diet_date_col:str='collection_timestamp',
          diet_text_col:str='shortname_eng',
          ax:Optional[matplotlib.axes._axes.Axes]=None, smooth:bool=False,
          sleep_tuples:Optional[List[Tuple[pandas._libs.tslibs.timestamps.
          Timestamp,pandas._libs.tslibs.timestamps.Timestamp]]]=None)

Initialize a CGMPlot object.

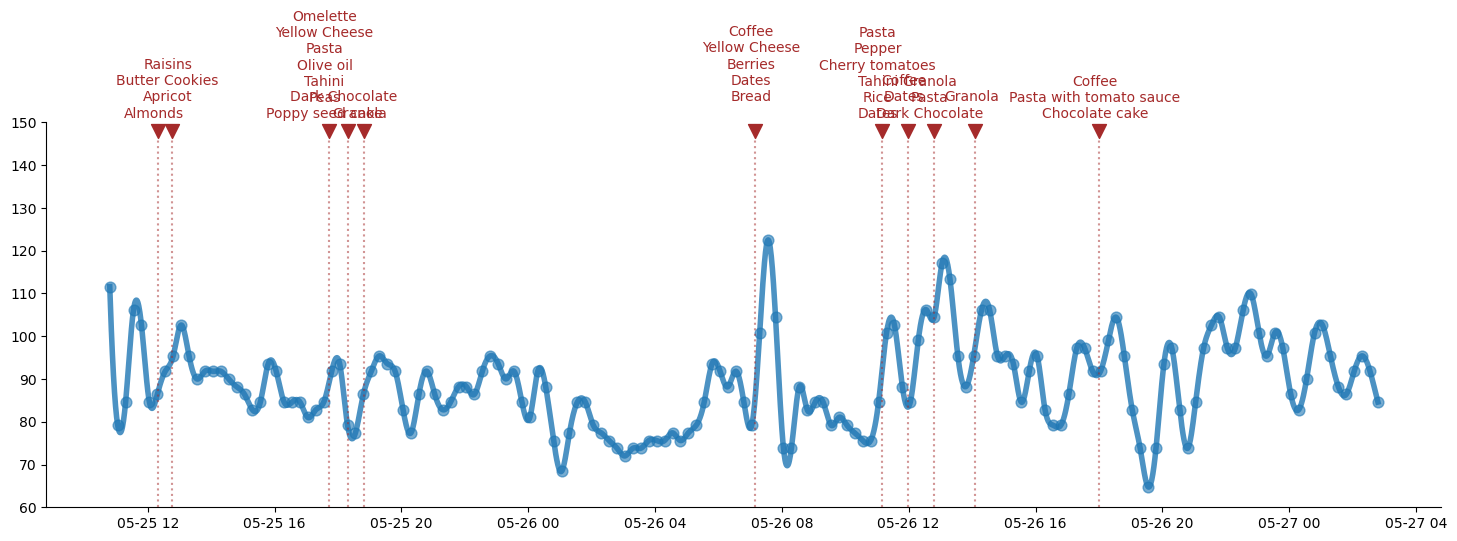
Args: cgm_df (pd.DataFrame): DataFrame containing the glucose measurements. diet_df (Optional[pd.DataFrame], optional): DataFrame containing the diet data. Defaults to None. cgm_date_col (str, optional): Name of the date column in cgm_df. Defaults to “Date”. gluc_col (str, optional): Name of the glucose column in cgm_df. Defaults to “glucose”. diet_date_col (str, optional): Name of the date column in diet_df. Defaults to “Date”. diet_text_col (str, optional): Name of the text column in diet_df. Defaults to “shortname_eng”. ax (Optional[plt.Axes], optional): Matplotlib Axes object to plot on. Defaults to None. smooth (bool, optional): Apply smoothing to the glucose curve. Defaults to False. sleep_tuples (Optional[List[Tuple[pd.Timestamp, pd.Timestamp]]], optional): List of sleep start and end times. Defaults to None.

cgm_df= pd.read_parquet("./examples/cgm/cgm.parquet")
cgm_df.head()
glucose
participant_id collection_timestamp connection_id
0 2020-05-25 10:48:00+03:00 1000001 111.6
2020-05-25 11:03:00+03:00 1000001 79.2
2020-05-25 11:18:00+03:00 1000001 84.6
2020-05-25 11:33:00+03:00 1000001 106.2
2020-05-25 11:48:00+03:00 1000001 102.6
diet_df = pd.read_parquet("./examples/diet_logging/diet.parquet")
diet_df.head()
collection_timestamp food_id weight shortname_eng
participant_id cohort
0 10k 2020-05-25 08:15:00+03:00 1007294 40.0 Coffee
10k 2020-05-25 08:15:00+03:00 1007417 87.0 Yellow Cheese
10k 2020-05-25 08:15:00+03:00 1008624 6.0 Almonds
10k 2020-05-25 08:15:00+03:00 1011642 12.0 Brazil nuts
10k 2020-05-25 10:05:00+03:00 1007118 100.0 Hummus
start_date = pd.to_datetime('2020-05-25', utc=True).tz_convert('Asia/Jerusalem')
end_date = pd.to_datetime('2020-05-27',utc=True).tz_convert('Asia/Jerusalem')


sample_days = cgm_df[(cgm_df.index.get_level_values('collection_timestamp') >= start_date) \
                     & (cgm_df.index.get_level_values('collection_timestamp') <= end_date)]
cgmplt = CGMPlot(cgm_df=sample_days.reset_index(),
                 cgm_date_col="collection_timestamp",
                 gluc_col="glucose",
                 diet_df=diet_df.iloc[9:],
                 diet_date_col="collection_timestamp",
                 smooth=True)
cgmplt.plot()

AGP


source

AGP

 AGP (cgm_df:pandas.core.frame.DataFrame,
      cgm_date_col:str='collection_timestamp', gluc_col:str='glucose',
      ax:Optional[matplotlib.axes._axes.Axes]=None)

Initialize an AGP object.

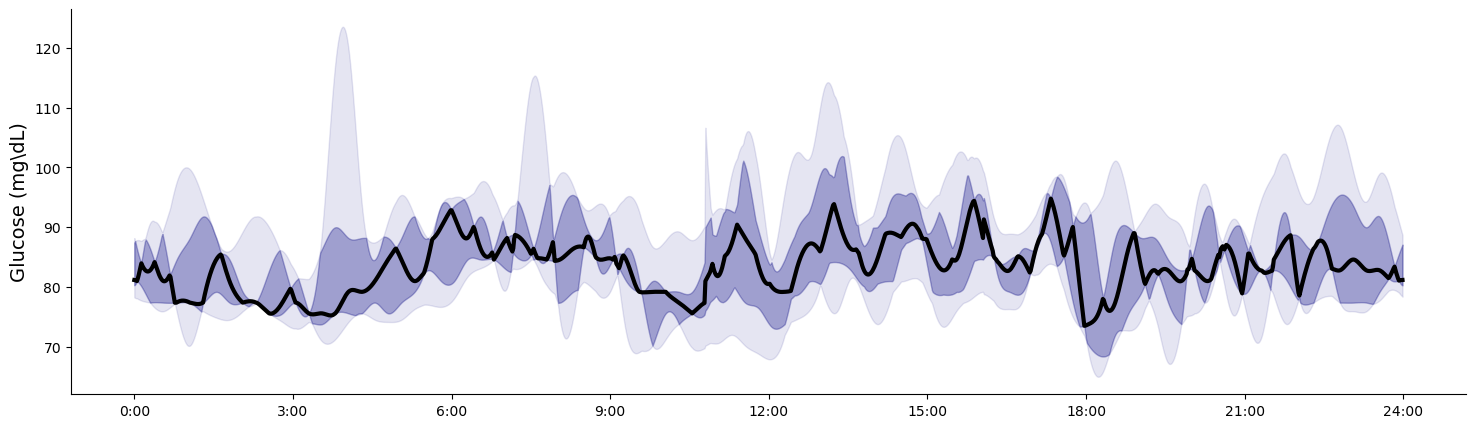
Args: cgm_df (pd.DataFrame): DataFrame containing the glucose measurements. cgm_date_col (str, optional): Name of the date column in cgm_df. Defaults to “collection_timestamp”. gluc_col (str, optional): Name of the glucose column in cgm_df. Defaults to “glucose”. ax (Optional[plt.Axes], optional): Matplotlib Axes object to plot on. Defaults to None.

agp = AGP(cgm_df=cgm_df.reset_index(), cgm_date_col="collection_timestamp", gluc_col="glucose")
agp.plot()